Data Collection
The ICOtronic package provides two different options to collect sensor data with the ICOtronic system:
Use the API to write your own Python scripts.
Use the
iconscript to collect data: We will describe how to measure some basic data with this script in the text below
Note: Since ICOn currently only provides very basic functionality for data collection you might be happier using one of the tools below:
ICOapi: A RESTful API for using the ICOtronic system via HTTP
ICOweb: A frontend/client developed in conjunction with the corresponding ICOapi backend. It is designed to be run in any form of modern browser.
ICOdaq: A closed source Electron application for Windows (based on ICOapi & ICOweb)
ICOc: A text based UI for Windows, based on an older deprecated version of the ICOtronic library.
Sensor Node Identifiers
To connect to a sensor node (SHA, STH, SMH) you need to know an identifier for the node, which can be one of the following:
Bluetooth advertisement name: up to 8 characters, no special characters allowed
Bluetooth MAC address: 8 Bytes, usually written in hexadecimal format
Node number: starting with 0, up to the number of available sensor nodes minus one (e.g. for 8 sensor nodes, the maximum sensor node number will be 7)
If you do not know any of the above identifiers for your sensor node you can use the command
icon list
to show the available nodes:
🤖 Name: Test-STH, Number: 0, MAC Address: 08-6B-D7-01-DE-81, RSSI: -51
In the example above, we see that one sensor node is available with the following identifiers:
node number:
0name:
Test-STHMAC address:
08-6B-D7-01-DE-81
Note: The last value “-51” of the example output is the current received signal strength indication (RSSI).
Collecting Data
After you determined one of the identifiers (name, MAC address, node number) of your sensor node you can use the command:
icon measure
to collect measurement data. For example, to collect data from an STH with the name “Test-STH” for 10 seconds you can use the following command:
icon measure --name Test-STH --time 10
After the measurement took place the command will print some information about the collected data, including the location of the HDF5 measurement file:
Sample Rate: 9523.81 Hz
Data Loss: 0.0 %
Filepath: Measurement_2025-05-14_15-11-25.hdf5
By default measurement files will be stored in the current working directory with
a name starting with the text
Measurementfollowed by a date/time-stamp, and
the extension
.hdf5.
Measurement Data
To take a look at the measurement data you can use the tool HDFView.
Note
Unfortunately you need to create a free account to download the program. If you do not want to register, then you can try if one of the accounts listed at BugMeNot works. Another option is to download the application from here. Just click on the folder for the latest version of the application (hdfview-…) and afterwards on the folder bin to see a list of compressed binaries (.zip & .tar.gz) for the different supported operating systems.
The screenshot below shows a measurement file produced by the ICOtronic library:
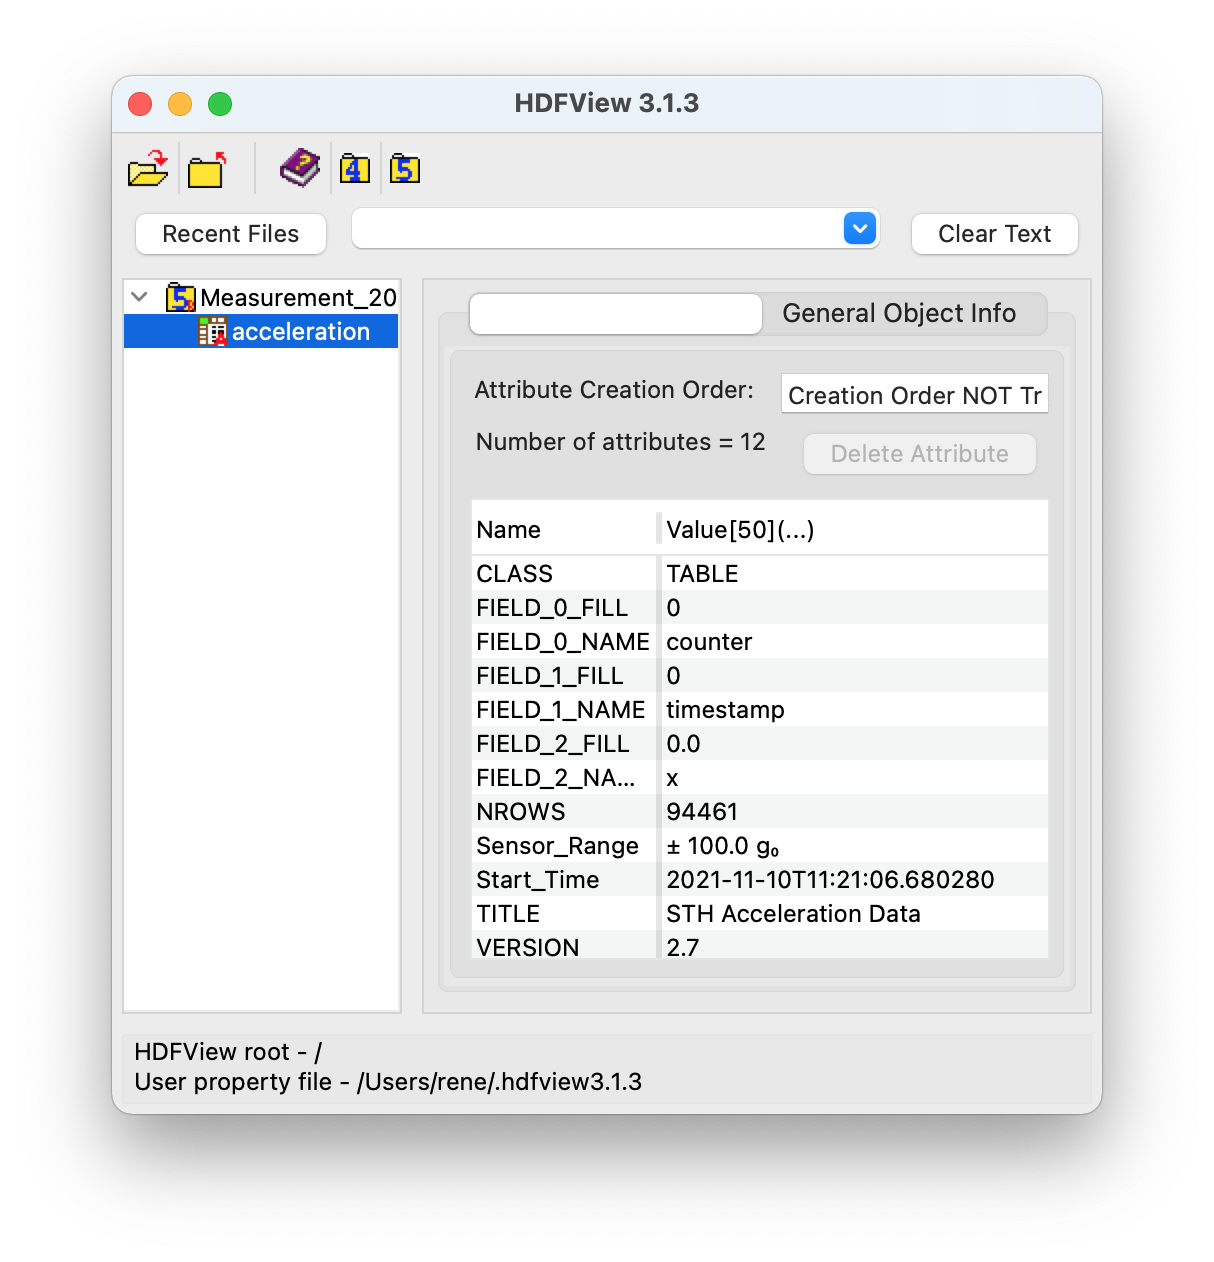
As you can see the table with the name acceleration stores the sensor data.
Note
The table is named “acceleration” mainly for historic reasons. While the main purpose of most sensor nodes is still collecting data using acceleration sensors, the table might also store other data such as temperature or force.
The screenshot above displays the metadata of the table. The most important meta attributes here are probably:
Start_Time, which contains the start time of the measurement run in ISO format, andSample_Rate, which specifies the (theoretical) number of samples taken per second.
After you double click on the acceleration table on the left, HDFView will show you the actual sensor data:
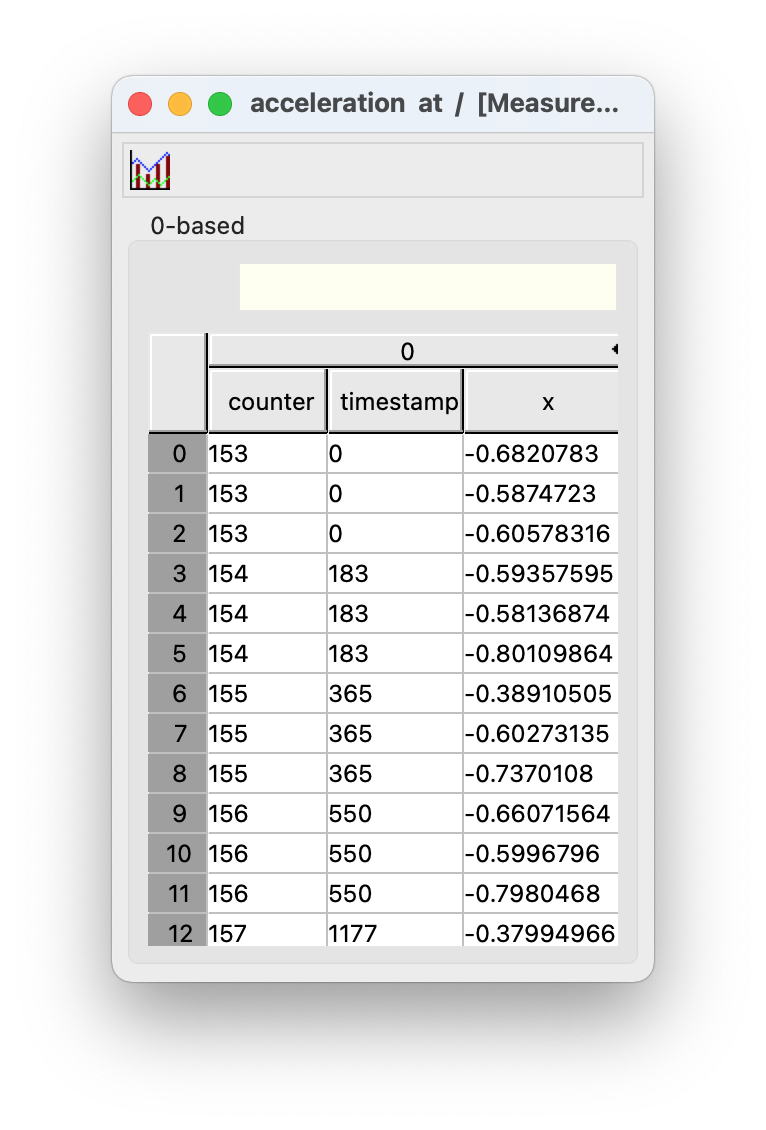
As you can infer from the x column above the table shows sensor data (as a 16 bit ADC value) for a single axis. The table below describes the meaning of the columns:
Column |
Description |
Range |
Unit |
|---|---|---|---|
counter |
A cyclic counter value sent with the acceleration data to recognize lost packets |
0 – 255 |
– |
timestamp |
The timestamp for the measured value in microseconds since the measurement start |
0 – 2⁶⁴-1 |
μs |
x |
16 Bit ADC sensor value |
0 – 2¹⁶-1 |
– |
Depending on your sensor and your settings the table might also contain columns for the y and/or z axis.
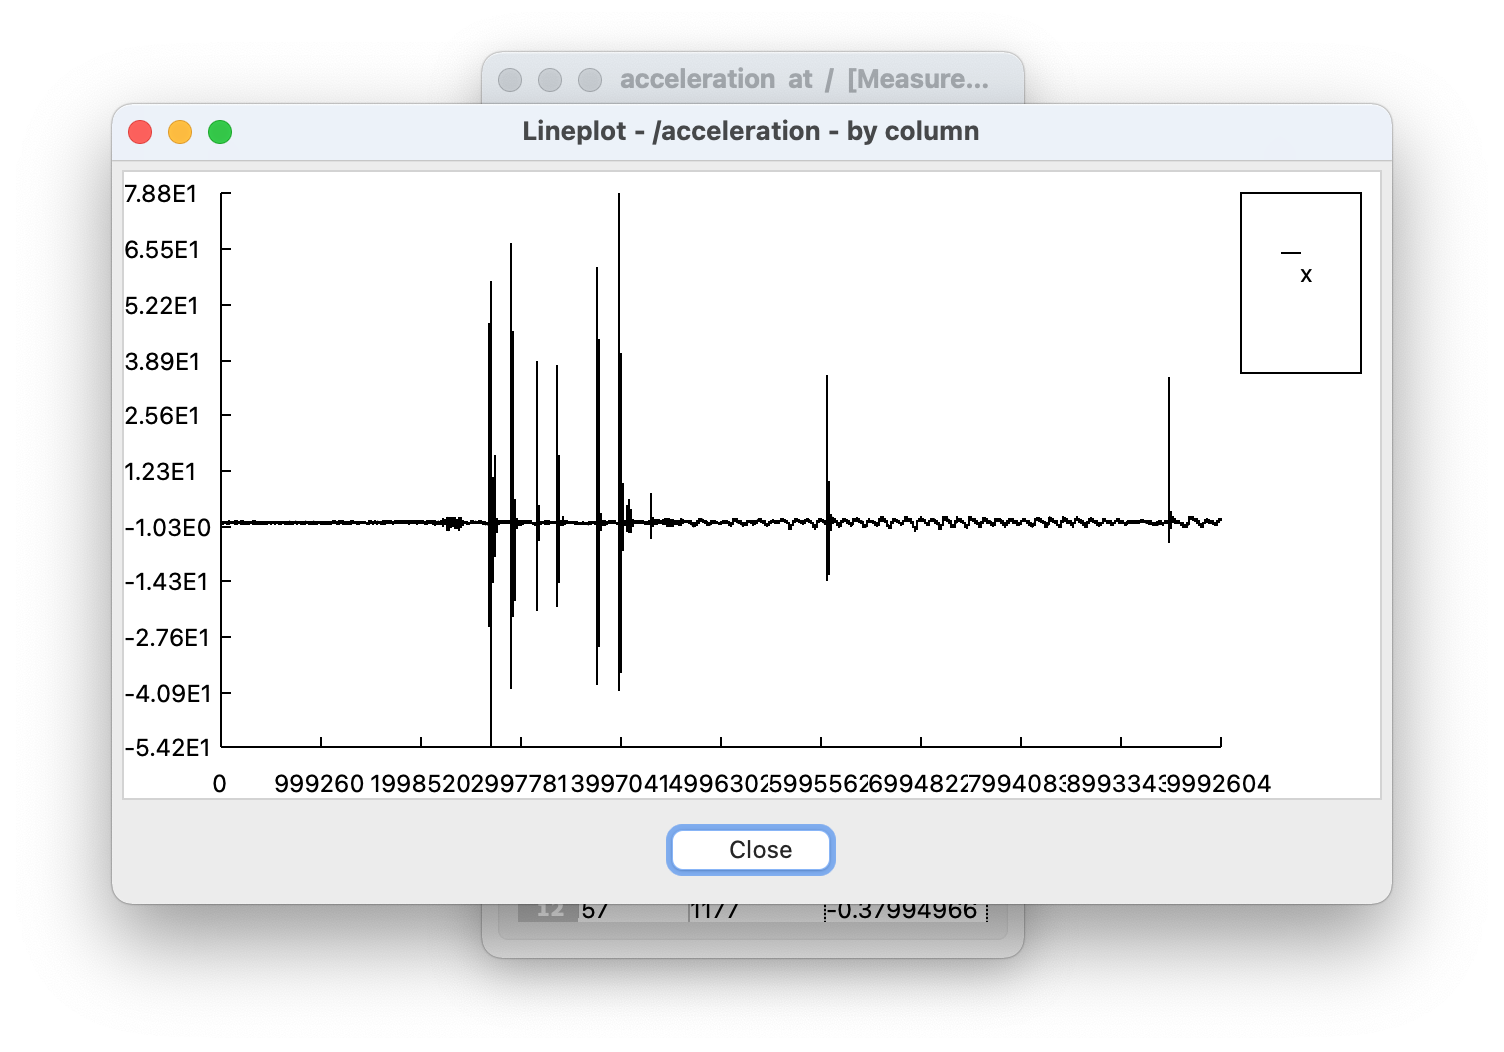
If you want you can also use HDFView to print a simple graph for your data. To do that:
Select the values for the the ordinate (e.g. click on the x column to select all acceleration data for the x axis)
Click on the graph icon in the top left corner
Choose the data for the abscissa (e.g. the timestamp column)
Click on the “OK” button
The screenshot below shows an example of such a graph:
For a more advanced analysis of the data files you can use our collection of measurement utilities ICOlyzer.
Adding Custom Metadata
Sometimes you also want to add additional data about a measurement. To do that you can also use HDFView. Since the tool opens files in read-only mode by default you need to change the default file access mode to “Read/Write” first:
Open HDFView
Click on “Tools” → “User Options”
Select “General Settings”
Under the text “Default File Access Mode” choose “Read/Write”
Close HDFView
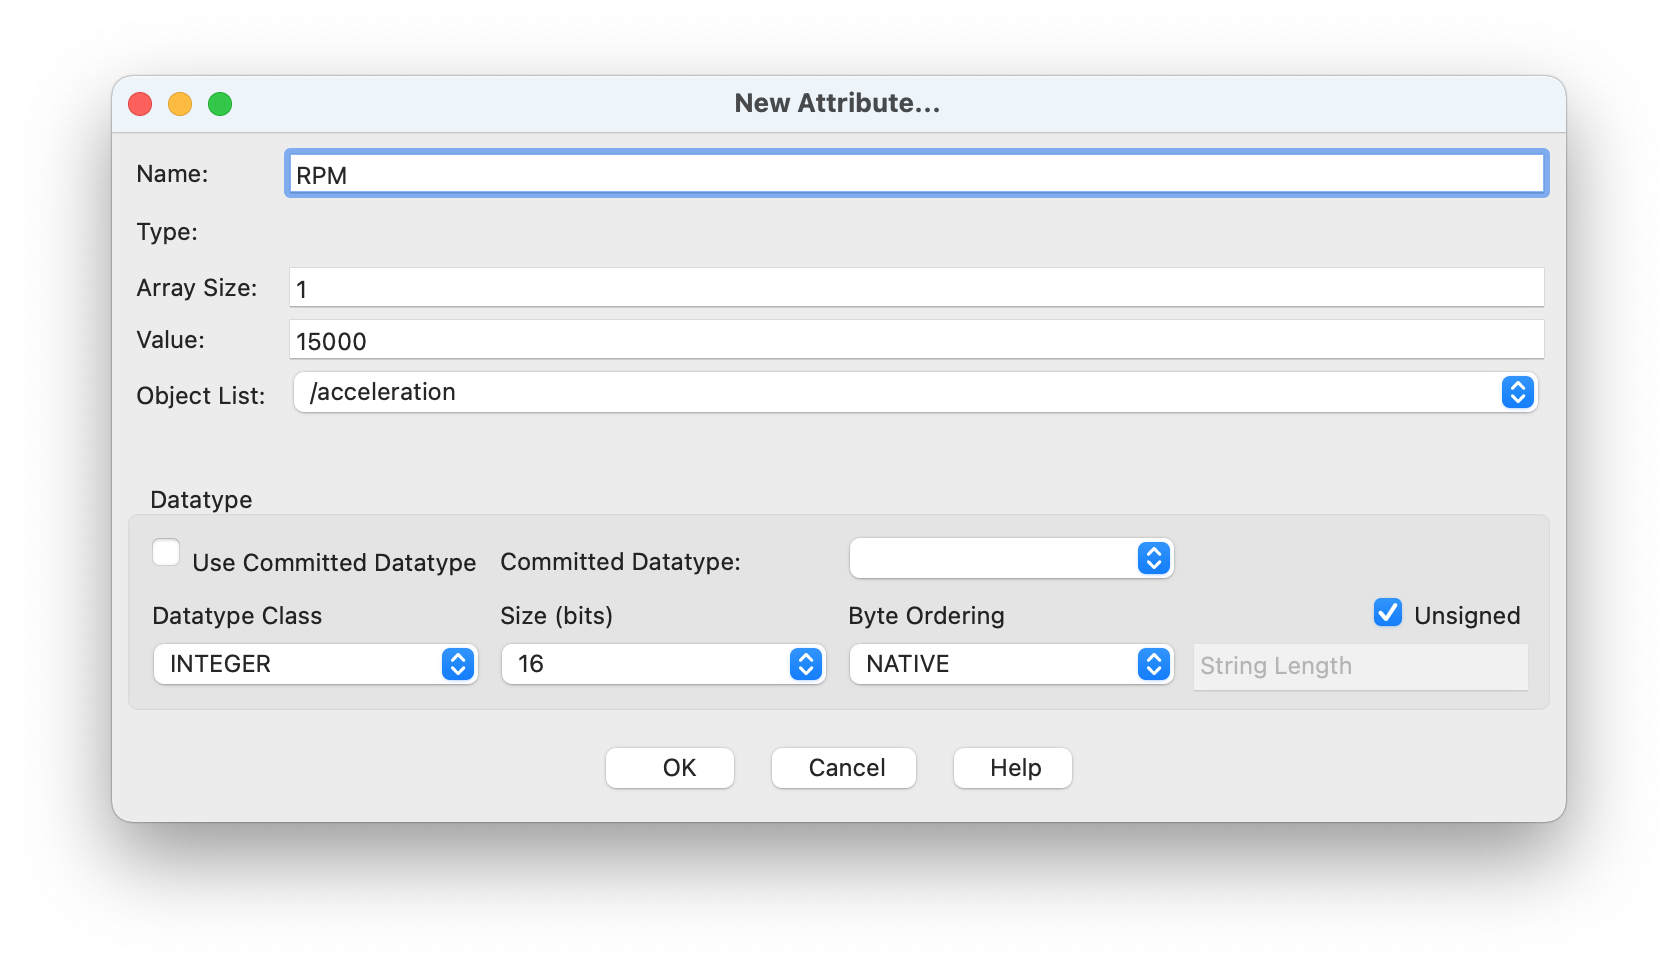
Now you should be able to add and modify attributes. For example, to add a revolutions per minute (RPM) value of 15000 you can use the following steps:
Open the measurement file in HDFView
Click on the table “acceleration” in the left part of the window
In the tab “Object Attribute Info” on the right, click on the button “Add attribute”
Check that “Object List” contains the value “/acceleration”
Enter the text “RPM” in the field “Name”
In the field “Value” enter the text “15000”
The “Datatype Class” should be set to “INTEGER”
For the size (in bits) choose a bit length that is large enough to store the value. In our example everything equal to or larger than 16 bits should work.
Optionally you can also check “Unsigned”, if you are sure that you only want to store positive values
Click the button “OK”
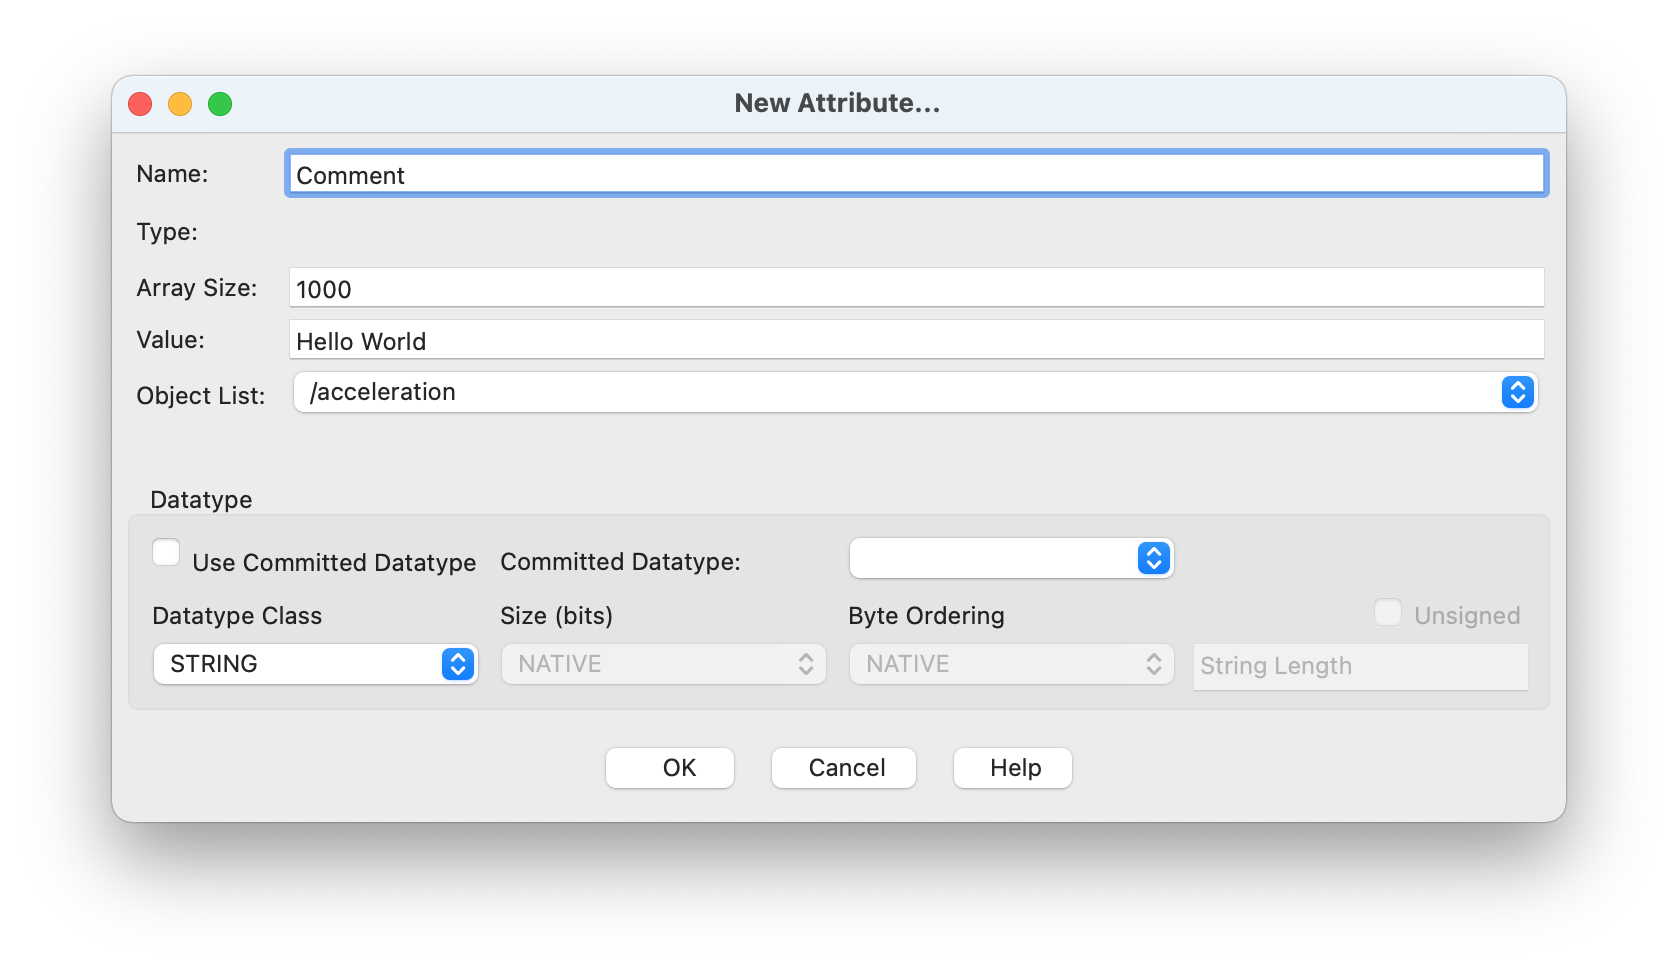
Sometimes you also want to add some general purpose data. For that you can use the “STRING” datatype class. For example, to store the text “hello world” in an attribute called “Comment” you can do the following
Repeat steps 1. – 4. from above
Choose “STRING” as “Datatype Class”
Under “Array Size” choose a length that is large enough to store the text such as “1000” (every size larger than or equal to 11 characters should work)
Click the button “OK”
If you want you can also add multiline text. Since you can not add newlines using ⏎ in HDFView directly, we recommend you open your favorite text editor to write the text and then copy and paste the text into the value field. HDFView will only show the last line of the pasted text. However, after you copy and paste the text into another program you will see that HDFView stored the text including the newlines.